|
Economic Statistics:
International
Merchandise Trade
||Production
||National Accounts
||Price Indices
|
|
|
|
IMPORTS BY S.I.T.C SECTIONS (US$'000) Last Updated August 4,2011. |
Click to Print This Page
|
|
S.I.T.C. SECTIONS |
Jan-Dec 2007 |
Jan-Dec 2008 |
Jan-Dec 2009 |
Jan-Dec 2010 |
Jan-Mar 2010 |
Jan-Mar 2011 |
|
TOTAL MERCHANDISE TRADE |
6,892,971 |
8,162,874 |
5,057,631 |
5,226,763 |
1,186,004 |
1,413,425 |
|
Of which Jamaica Free Zone* |
n/a |
n/a |
n/a |
226,812 |
36,916 |
29,553 |
|
|
|
|
|
|
|
|
|
|
TOTAL (incl. Single Entity Free Zone) |
6,892,971 |
8,162,874 |
5,057,631 |
5,194,633 |
1,186,004 |
1,413,425 |
|
0 |
Food |
730,660 |
885,083 |
801,874 |
805,995 |
181,326 |
226,028 |
|
1 |
Beverages and Tobacco |
93,163 |
93,485 |
79,862 |
75,152 |
18,214 |
19,717 |
|
2 |
Crude Materials (excl. Fuel) |
67,564 |
73,428 |
54,867 |
60,810 |
14,607 |
16,500 |
|
3 |
Mineral Fuels, etcetera |
2,428,935 |
3,150,427 |
1,419,422 |
1,585,555 |
413,790 |
519,366 |
|
4 |
Animal & Vegetable Oils & Fats |
31,634 |
53,945 |
33,855 |
32,636 |
3,905 |
14,045 |
|
5 |
Chemicals |
848,998 |
959,663 |
738,704 |
692,464 |
134,591 |
160,994 |
|
6 |
Manufactured Goods |
753,363 |
883,066 |
555,494 |
582,995 |
129,911 |
151,488 |
|
7 |
Machinery and Transport Equipment |
1,252,368 |
1,264,233 |
819,713 |
786,036 |
157,915 |
187,611 |
|
8 |
Misc. Manufactured Articles |
591,206 |
681,292 |
461,047 |
477,280 |
112,456 |
97,312 |
|
9 |
Other |
95,080 |
118,251 |
92,792 |
95,710 |
19,289 |
20,365 |
|
* The Jamaica Free Zone includes Montego Bay Free Zone, Kingston Free Zone and
Single Entry Free Zone Companies. |
|
|
|
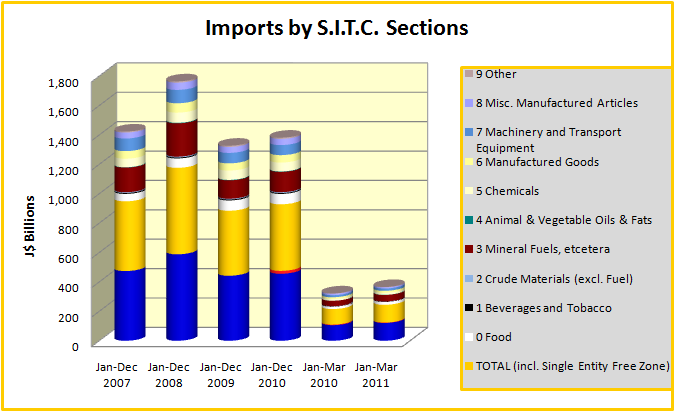
IMPORTS BY S.I.T.C. SECTIONS (J$'000) Last Updated August 4, 2011. |
|
S.I.T.C. SECTIONS |
Jan-Dec 2007 |
Jan-Dec 2008 |
Jan-Dec 2009 |
Jan-Dec 2010 |
Jan-Mar 2010 |
Jan-Mar 2011 |
|
TOTAL MERCHANDISE TRADE |
474,491,562 |
588,263,569 |
442,362,416 |
455,892,201 |
106,095,094 |
121,052,643 |
|
Of which Jamaica Free Zone* |
n/a |
n/a |
n/a |
19,643,570 |
3,750,572 |
2,531,951 |
|
|
|
|
|
|
|
|
|
|
TOTAL (incl. Single Entity Free Zone) |
474,491,562 |
588,263,569 |
442,362,416 |
453,094,318 |
106,095,094 |
121,052,643 |
|
0 |
Food |
50,314,568 |
63,996,256 |
69,983,810 |
70,395,550 |
16,226,558 |
19,355,714 |
|
1 |
Beverages and Tobacco |
6,410,254 |
6,759,729 |
7,007,617 |
6,557,166 |
1,630,001 |
1,688,139 |
|
2 |
Crude Materials (excl. Fuel) |
4,642,237 |
5,286,302 |
4,833,155 |
5,315,644 |
1,307,076 |
1,412,645 |
|
3 |
Mineral Fuels, etcetera |
168,022,630 |
226,802,098 |
124,996,495 |
138,246,416 |
37,023,899 |
44,471,449 |
|
4 |
Animal & Vegetable Oils & Fats |
2,160,541 |
3,896,020 |
2,972,243 |
2,872,180 |
349,546 |
1,204,567 |
|
5 |
Chemicals |
58,248,865 |
69,094,289 |
64,019,439 |
60,266,405 |
12,032,539 |
13,786,307 |
|
6 |
Manufactured Goods |
51,755,107 |
63,619,355 |
48,656,197 |
50,849,338 |
11,623,172 |
12,972,561 |
|
7 |
Machinery and Transport Equipment |
85,744,580 |
91,023,792 |
71,215,682 |
68,606,723 |
14,119,872 |
16,080,304 |
|
8 |
Misc. Manufactured Articles |
40,618,370 |
49,108,964 |
40,472,506 |
41,674,222 |
10,056,727 |
8,336,984 |
|
9 |
Other |
6,574,409 |
8,676,764 |
8,205,270 |
8,310,674 |
1,725,702 |
1,743,973 |
|
* The Jamaica Free Zone includes Montego Bay Free Zone, Kingston Free Zone and
Single Entry Free Zone Companies. |
|
|
|
|